Empower your manufacturing operations toward industry excellence
Explore injection molding process optimization and scientific molding to enhance efficiency with tailored engineering services.
Our mission is to elevate manufacturing processes by enhancing quality, improving efficiency, reducing production costs, and maximizing profitability for our clients.
We collaborate closely with companies to optimize injection molding operations, minimize manufacturing expenses, and drive sustainable growth.
Our consulting services cover a comprehensive range of areas, including process control and optimization, with methodologies grounded in Scientific Molding, Design of Experiments (DOE), Statistical Process Control (SPC), and Six Sigma applications.
We also provide expertise in equipment and material selection, process troubleshooting, product design and development, robotics and automation, quality assurance, maintenance and the preparation of detailed, industry-standard documentation.

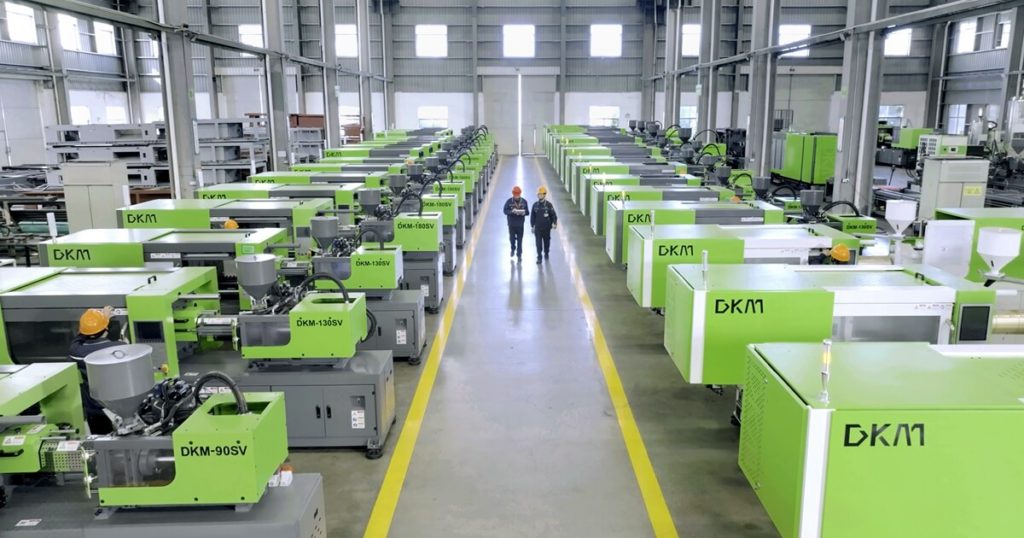


Our injection molding process optimization service focuses on attention to detail so you can relax.
Drawing on our deep understanding of various facets of the injection molding process, we offer tailored guidance to enhance production processes and increase operational efficiency.
We provide invaluable insights and cost-effective injection molding process optimization, along with a suite of solutions designed to bolster manufacturing operations and drive profitability for companies.
Streamline Your Operations
with Suensa
With a commitment to excellence, innovation, and customer satisfaction, we offer a comprehensive range of services tailored to meet the diverse needs of our clients.

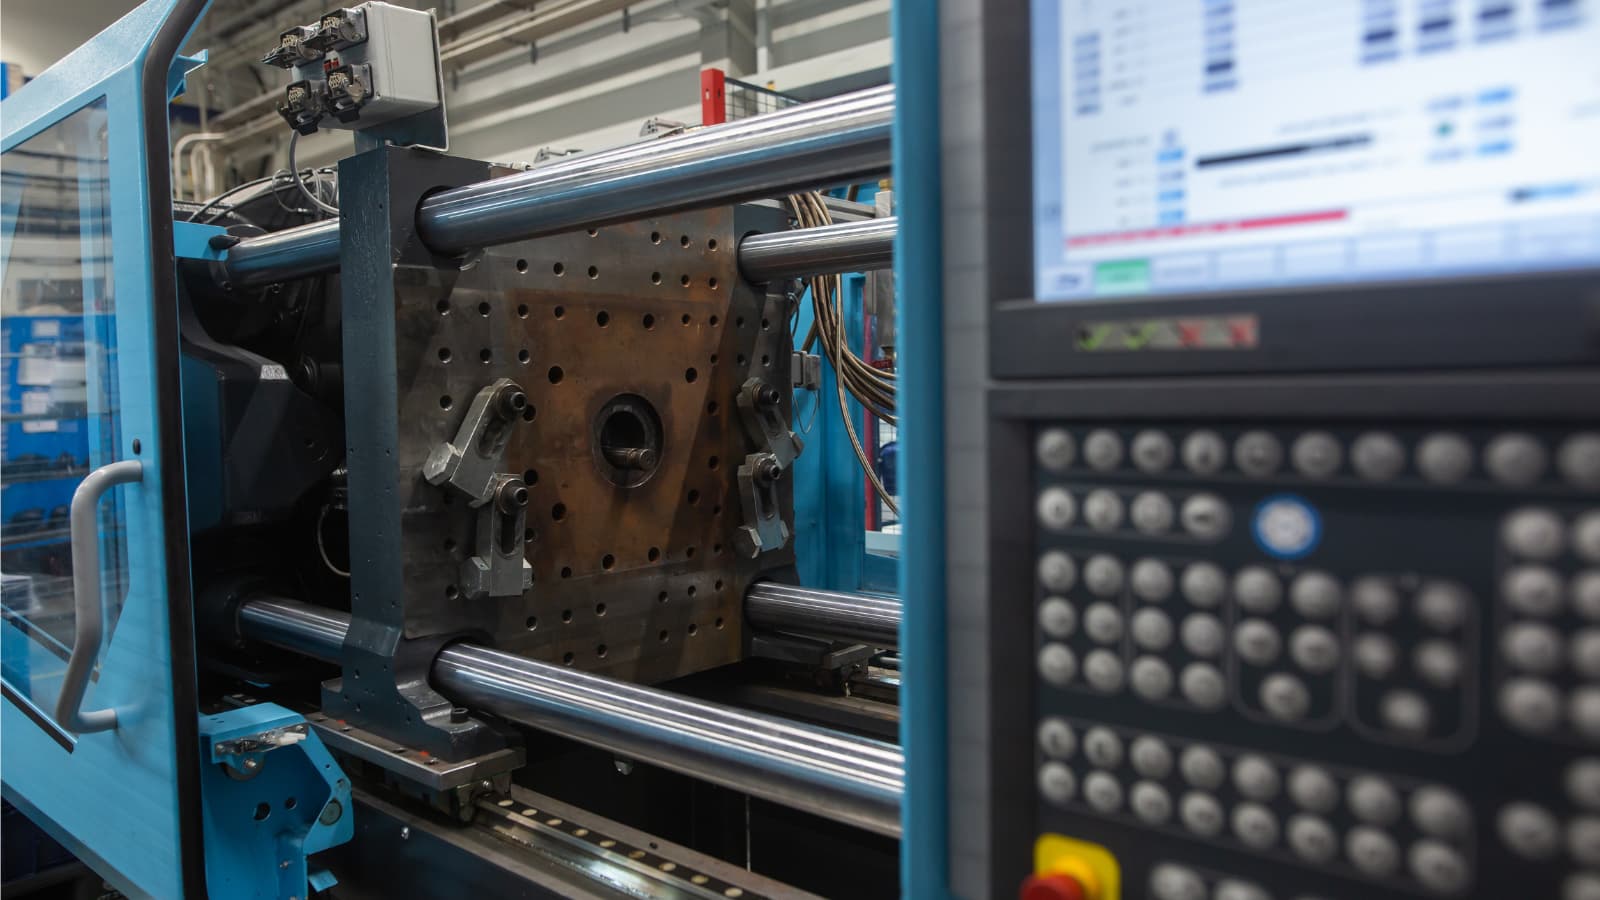
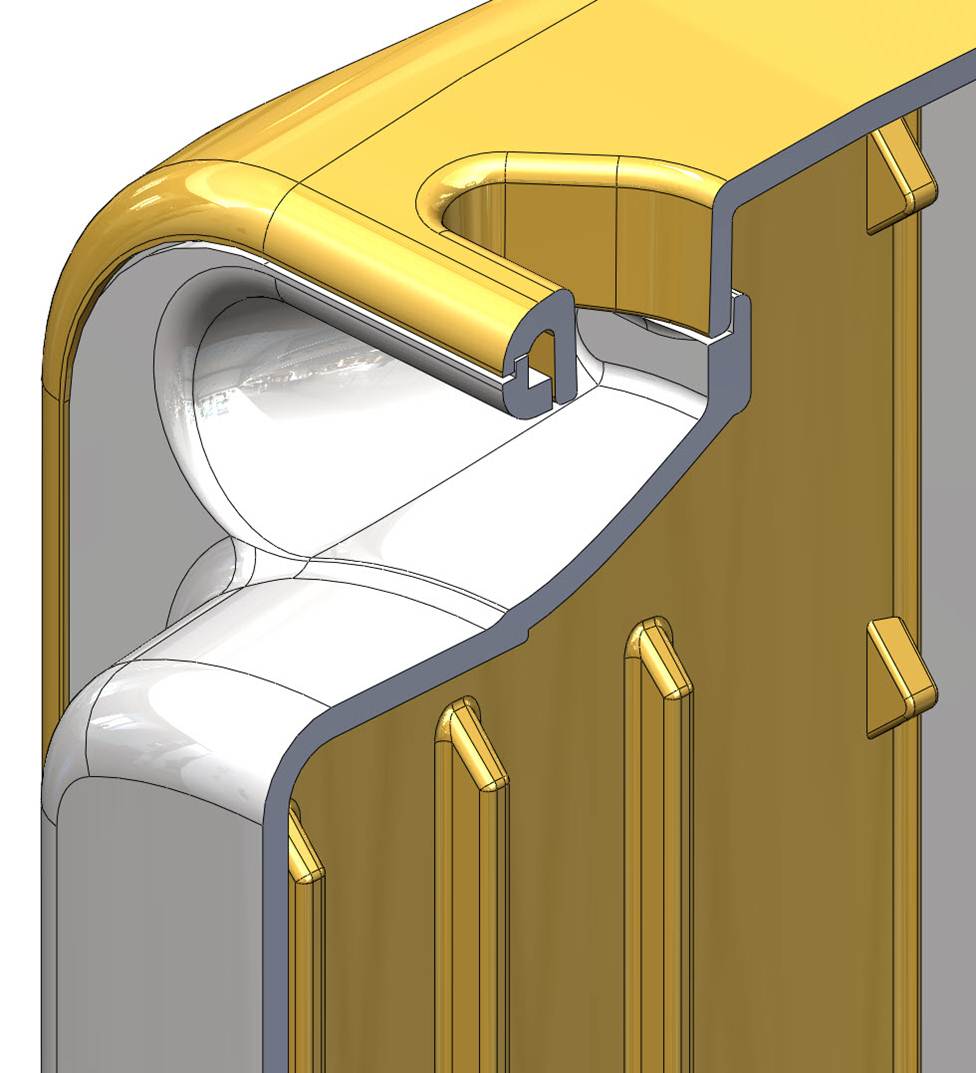

Injection Molding Process Optimization
How it works?
24 steps to perfection.
1. Product Review
Evaluating the product’s design and functionality to identify optimization opportunities
2. Material Review
Evaluating material properties and suitability for the intended application.
3. Regrind Usage Review
Analyzing the incorporation of regrind material for cost and sustainability benefits.
4. Mold Review
Examining the mold design, mold specifications and condition for potential enhancements.
5. Injection Molding Machine
Optimizing machine parameters for efficiency and quality.
6. Auxiliary Equipment
Assessing auxiliary equipment effectiveness in the molding process.
7. Process Review
Reviewing the current molding process for improvement possibilities.
8. Clamping Improvements
Enhancing clamping mechanisms for better part consistency and cycle times.
9. Mold Temperatures
Adjusting mold temperatures according to material and process for improved part quality and cycle times.
10. Barrel Temperatures
Fine-tuning barrel temperatures to ensure proper material flow and part consistency.
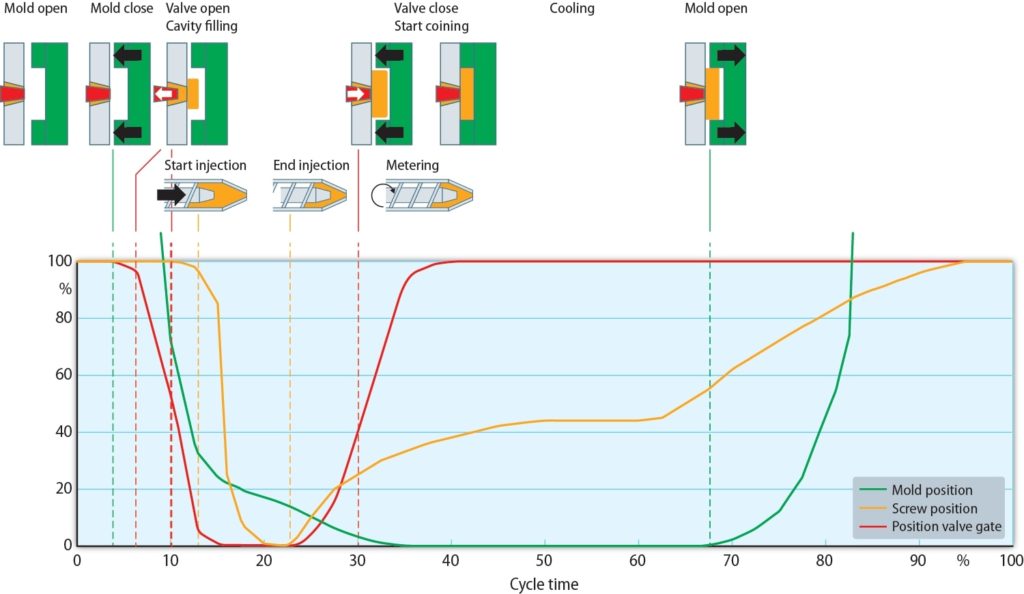
11. Injection Improvements
Refining injection parameters for optimal part filling and quality.
12. Air Jets Review
Evaluating air jet usage for part ejection efficiency.
13. Valve Gates Review
Assessing valve gate performance for precise material control.
14. Hydraulic Cores Review
Optimizing hydraulic core functions for complex part molding.
15. Ejector Improvements
Enhancing ejector system performance for smoother part ejection.
16. Robot/EOAT Improvements
Improving robotic systems and End-of-Arm Tooling (EOAT) for efficient, faster and safe part handling.
17. Cooling Time Review
Analyzing cooling times to reduce cycle times without compromising part quality.
18. Process Sequencing
Optimizing the sequence of process steps for efficiency and better cycle times.
19. Final Process Review
Conducting a comprehensive review of the optimized process for final adjustments.
20. Process Troubleshooting
Addressing any issues or inefficiencies that can arise during the process.
21. Monitoring Phase
Implementing monitoring phase to ensure ongoing process stability and quality control.
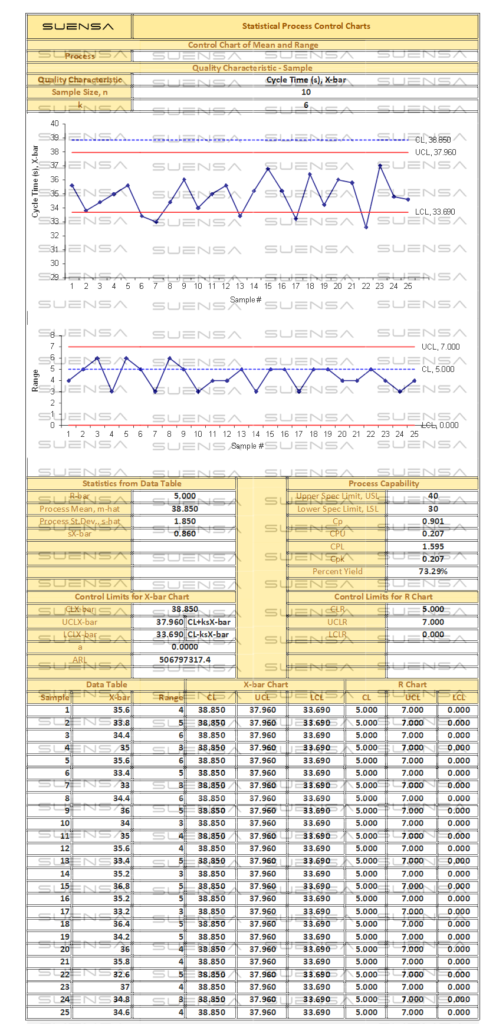
22. Statistical Process Control (SPC) Improvements
Enhancing SPC methods for better process control and consistency.
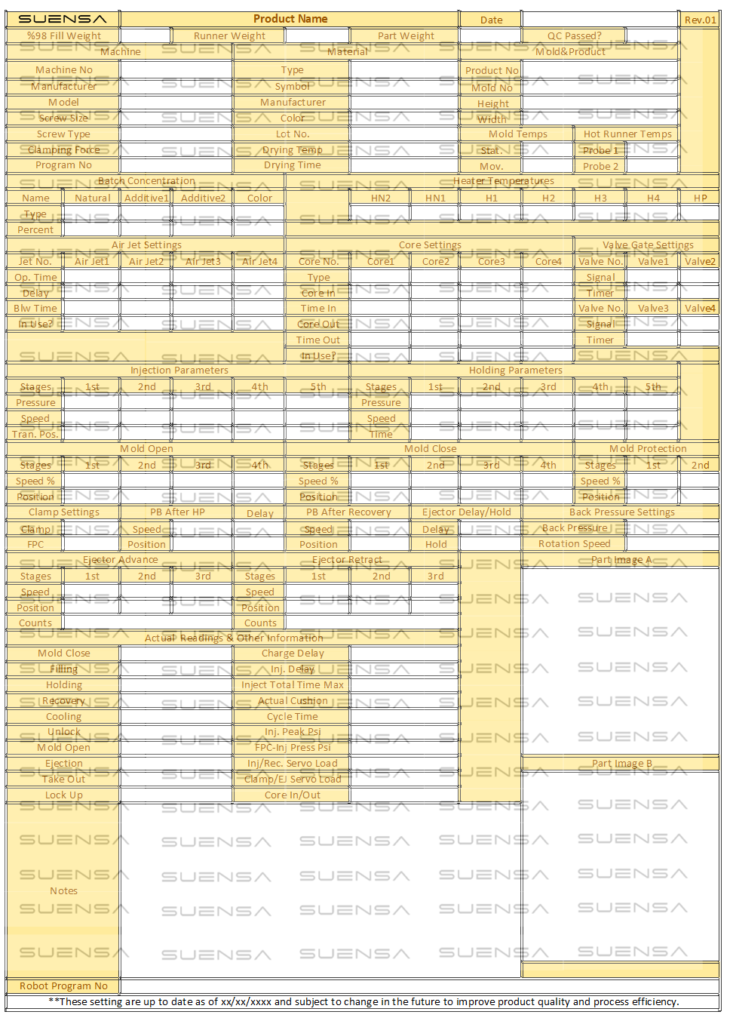
23. Process Setup Sheet Preparation
Documenting optimized process settings for future reference and consistency.
24. 24/7 Remote Support
Providing continuous remote support for immediate assistance and troubleshooting.
Industries We Serve
We proudly serve a wide range of industries, offering customized solutions that address the unique challenges and requirements of each sector. With our expertise and diverse services, we help businesses across multiple industries achieve operational excellence and sustainable growth.


Why Chose Us?
When you choose to partner with us, you gain access to a range of strategic advantages designed to propel your operations forward.
Improved Cycle Times
We streamline your processes to ensure faster completion of tasks, better quality and productivity, helping you meet deadlines and improve customer satisfaction.
Enhanced Efficiency
By optimizing your workflows, we help you achieve higher productivity with minimal scrap and waste, maximizing the use of your resources.
Increased Productivity
Our solutions enable you to accomplish more with the same resources but better cycle times, boosting your overall productivity and competitiveness.
Better Quality
Consistently deliver superior products and services with our quality enhancement strategies, building trust and loyalty with your customers.
Increased ROI
Experience greater returns on your investments as our optimized processes and cost-saving measures improve your financial performance.
Reduced Waste
Adopt our sustainable practices to effectively manage and reduce waste, contributing to environmental conservation and operational efficiency.
Reduced Downtime
We implement strategies to minimize downtimes, ensuring your operations run smoothly and continuously, reducing costly delays and interruptions.
Greater Cost Savings
Through efficient practices and waste reduction, we help you save money, allowing you to allocate resources to other critical areas of your business.
Lower Operational Expenses
Our approach helps you cut down on daily expenses, contributing to a healthier bottom line without compromising on quality.
Superior Documentation
We ensure that all your records are detailed, accurate, and easily accessible, facilitating better decision-making and compliance.
Lower Energy Consumption
Our sustainable practices reduce your energy consumption, which is not only good for the environment but also lowers your operational expenses.
Higher Profits
By implementing our effective solutions, you can significantly boost your profitability, driving long-term success and growth.
Precision Engineering Solutions
At Suensa, we take pride in providing specialized engineering solutions to a diverse range of industries, including aerospace, automotive, appliances, consumer goods, electronics, energy, furniture, food, and medical sectors. Our mission is to deliver tailored strategies that drive efficiency, foster innovation, and achieve excellence across all sectors we serve. By understanding the specific needs of each industry, we help our clients overcome challenges, reduce costs, enhance product quality, and achieve sustainable growth.
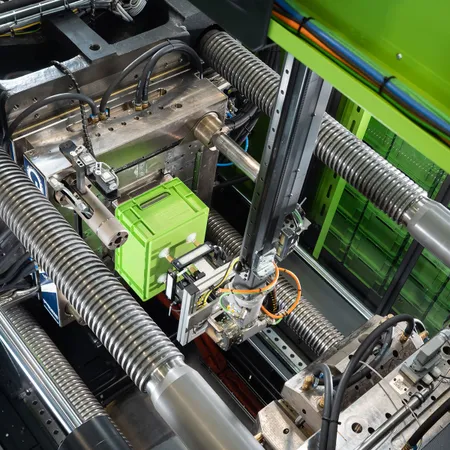

Your Success, Our Commitment
Your success is our commitment. Suensa’s process optimization and consultation services go beyond problem-solving; we build solutions that last. By partnering with Suensa, you gain a trusted ally committed to transforming challenges into opportunities. Together, we’ll shape the future of your industry with innovative solutions that drive sustainable growth and operational excellence across sectors.
Innovative Manufacturing Strategies
At Suensa, we believe that innovation is the key to staying ahead in today’s competitive manufacturing landscape. Our expert team combines cutting-edge technology with industry best practices to develop manufacturing strategies that enhance productivity, improve quality, and reduce production costs. Whether you need process optimization, material selection guidance, or advanced automation solutions, we provide customized strategies that align with your business goals and drive long-term success.
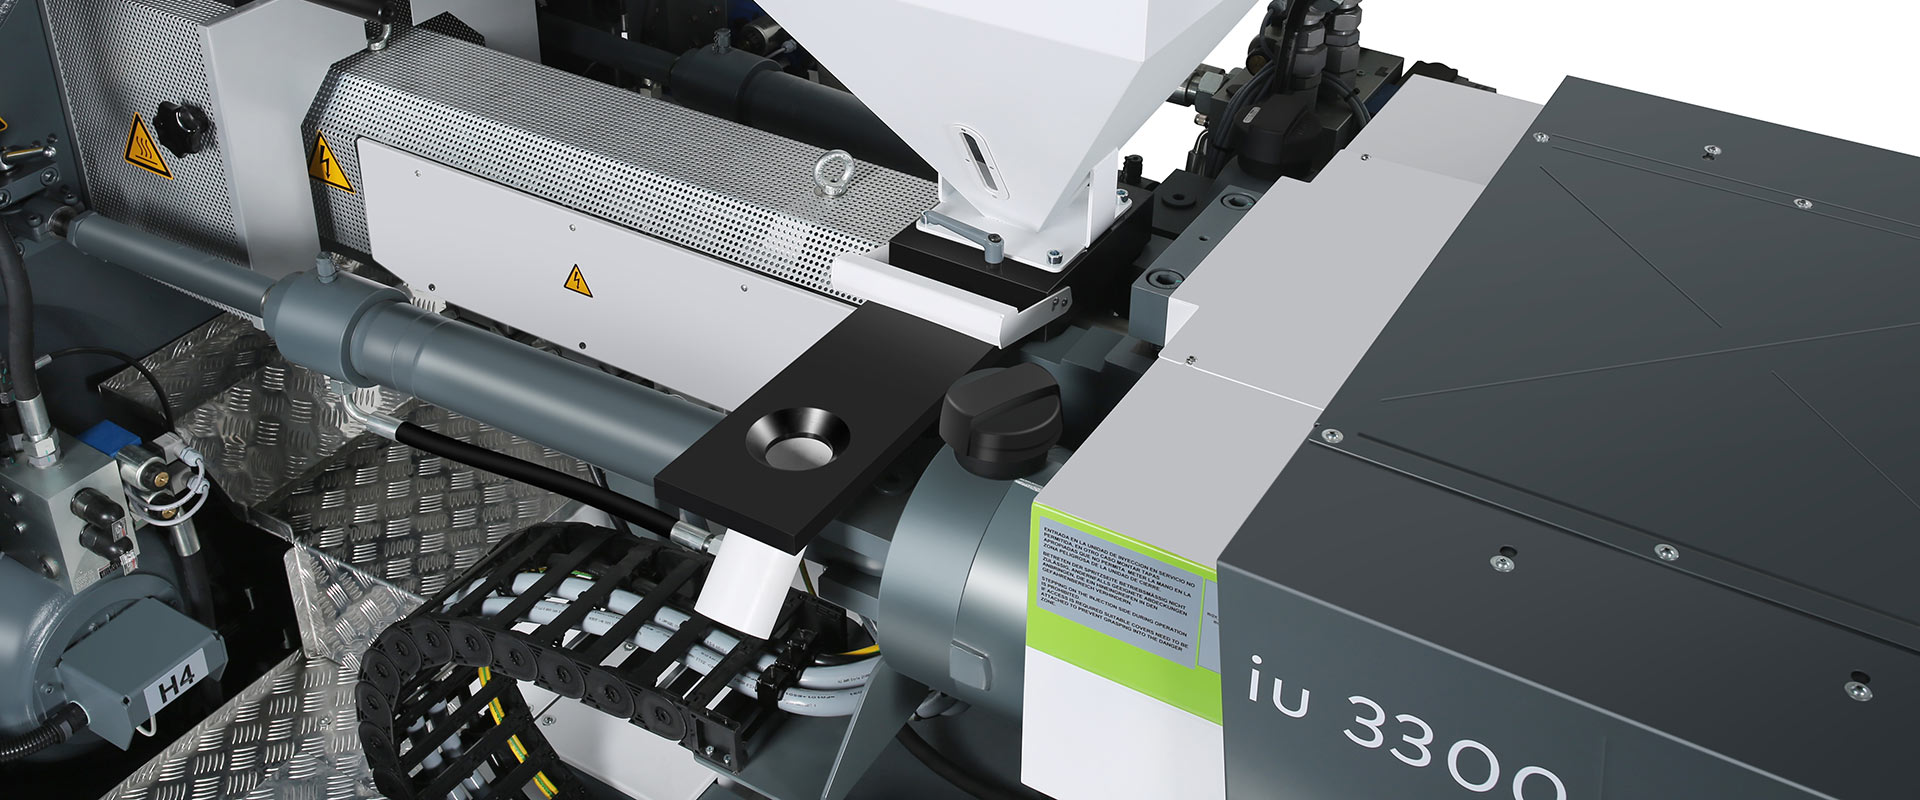

From Concept to Production
Turning an idea into a market-ready product requires precision, expertise, and a deep understanding of manufacturing processes. Suensa supports clients at every stage, from initial concept development to full-scale production. Our team ensures that designs are optimized for manufacturability, minimizing waste and maximizing efficiency. With our hands-on approach and industry-leading expertise, we help bring your vision to life while ensuring cost-effectiveness and superior product quality.
Document Downloads
We are here to make things easier.
One platform. Infinite possibilities.
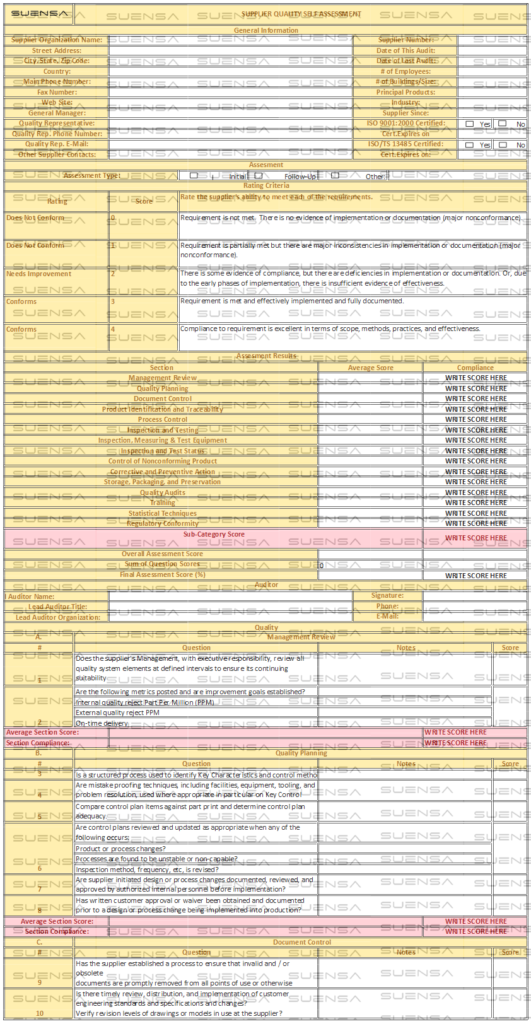
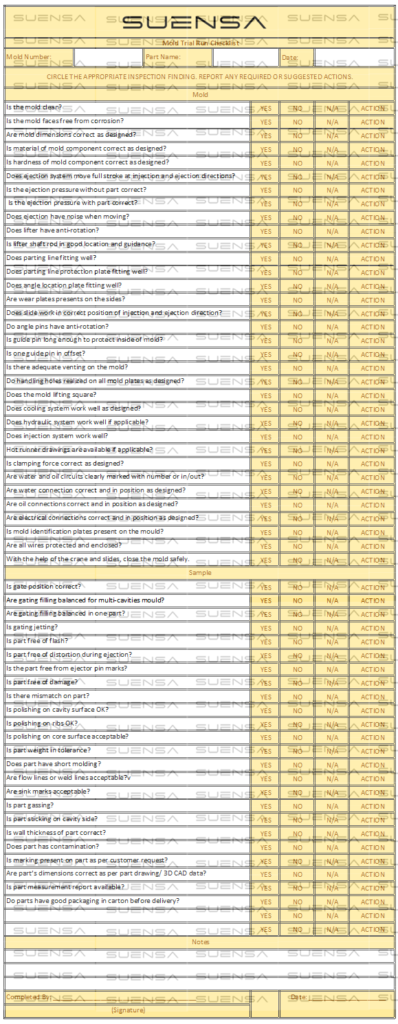
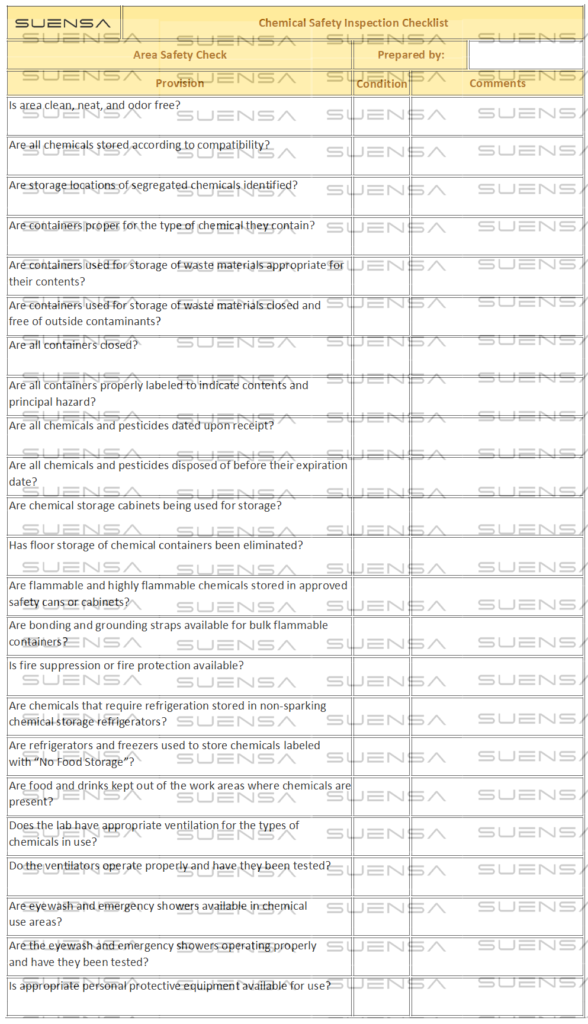
Comprehensive Templates and Checklists
Access a library of ready-to-use templates and checklists designed to streamline various operational tasks, from quality inspections to process audits, saving you time and ensuring consistency.
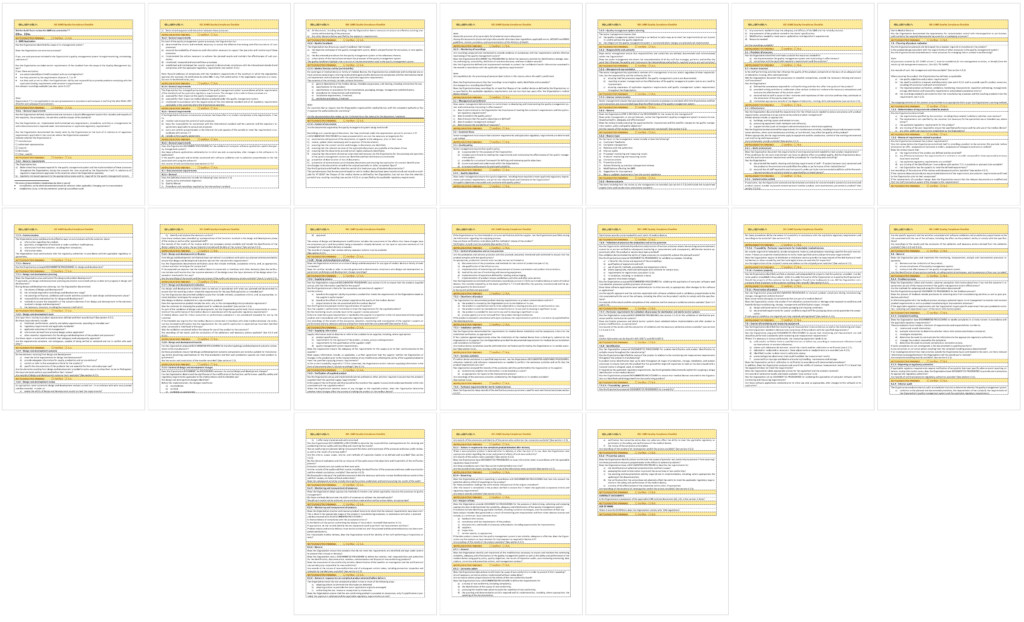
Industry-Standard Documentation
Download essential documentation that aligns with QMS and industry standards, including FDA and ISO guidelines, helping you meet compliance requirements efficiently and effectively.
Customizable Documents in Word and Excel Formats
Access a variety of downloadable documents, including templates and forms in Word and Excel formats, allowing for easy customization to suit your specific operational needs and workflows.
At Suensa, we understand the importance of having comprehensive and easily accessible documentation for manufacturing plants. Our extensive collection of documents is designed to support your operations, ensuring efficiency, safety, and quality at every step. Whether you need detailed process instructions, maintenance logs, quality assurance checklists, or business operation plans, we have you covered. Most of our documents are available in Word or Excel format for your convenience.
Browse through our documentation templates below to find the specific documentation you need to streamline your processes and enhance your manufacturing capabilities.
Request a Quote Today!
Partnering with Suensa means unlocking a comprehensive suite of resources and support designed to ensure the success of your projects. Upon engaging our services, you’ll gain exclusive access to your personalized dashboard, where you can view and track project deliverables at any time. This includes accessing purchased downloads, documentation tailored to the services you’ve signed up for—such as process optimization related setup sheets, detailed reports, automation insights, SPC charts, process troubleshooting reports, documentation, product designs—and managing additional details like membership status, payment plans, and more.
Our engineering services are crafted to build lasting partnerships, supporting continuous improvement and delivering impactful, sustainable solutions. Members also enjoy a host of benefits, including:
24/7 Process Support
Our member companies benefit from continuous process support and monitoring, ensuring seamless and ongoing process adjustments while proactively identifying opportunities for improvement.
Troubleshooting Assistance
When challenges arise, we’re ready to help. Our expertise in precise problem-solving ensures smooth manufacturing operations and quick resolutions to complex issues.
Priority Turnaround
Accelerate your project timelines with priority turnaround times. Whether you need process optimization, troubleshooting, robotics and automation solutions, or product design, we deliver with speed and precision.
Downloads
Access an extensive library of essential manufacturing documents, including professional templates designed to save time and streamline your operations.

